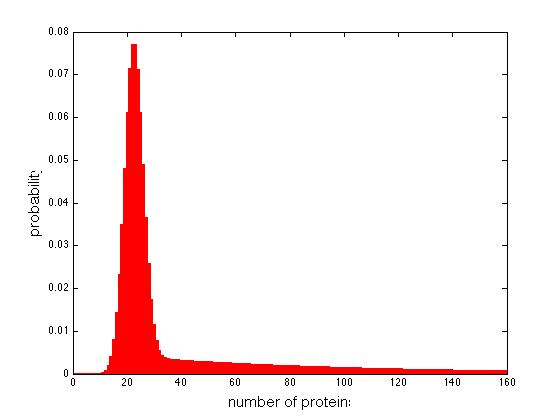
To plot the distribution at td1 = 0.8 in Fig. 2B:
>> n= [0:160]; bar(n, prot2(n, 0.8, [0.5 100], 50));
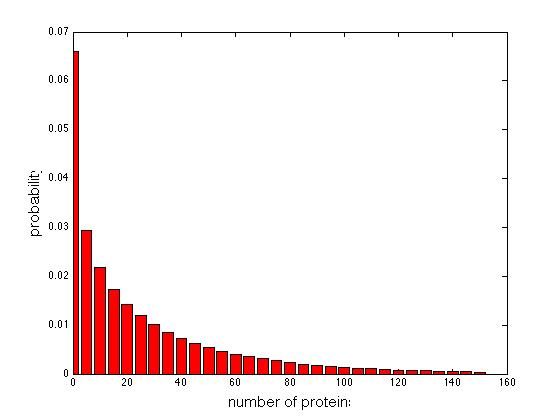
To plot the distribution in Fig. 3C:
>> n= [0:5:150]; bar(n, prot3(n, [1 40 6 2]));
Matlab files:
(Right click or left click and use the `File' menu to download. Octave is a free equivalent to Matlab.)
| prot2.m (Eq. 10 in the paper) |
| prot3.m (Eq. 18 in the paper) |
Examples
To plot the distribution at td1 = 0.8 in Fig. 2B:
>> n= [0:160]; bar(n, prot2(n, 0.8, [0.5 100], 50));
To plot the distribution in Fig. 3C:
>> n= [0:5:150]; bar(n, prot3(n, [1 40 6 2]));